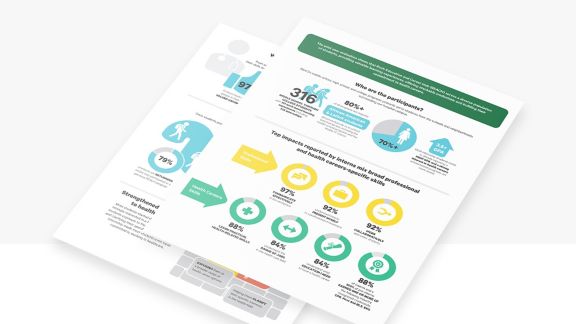
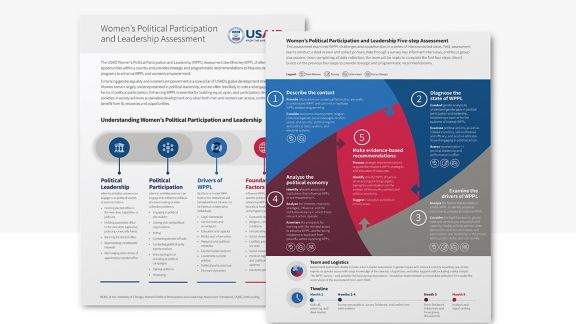
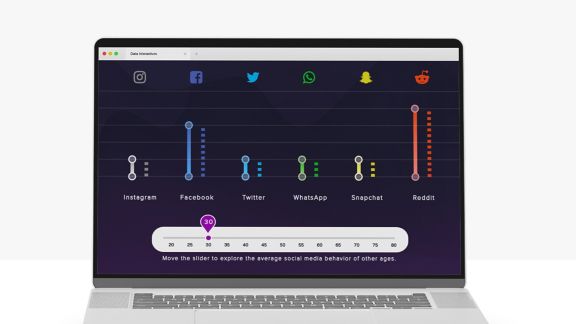
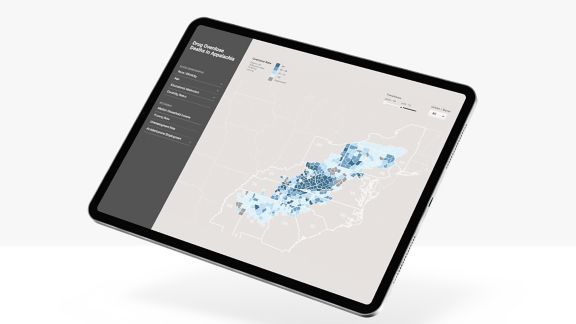
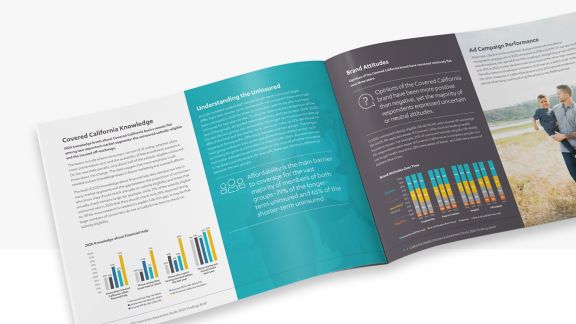
NORC VizStudio is a creative community of experts who turn complex data into clear and compelling visual stories. Grounded in NORC’s 80-plus years of research and data science expertise, our team includes researchers, statisticians, digital designers, and communications and IT professionals. They work together to assure excellence from all angles—scientific, communication, technical, and visual. The result is research that is more easily shared, embraced, and turned into action.
We promise “wow.” We create beautiful visualizations that grab attention and hold it, that simultaneously fascinate and illuminate. Our visualizations inspire readers to explore the data and draw inferences that can lead to action.
We promise clarity. We make data reader-friendly without misrepresenting or oversimplifying the research. Compelling visuals and concise, engaging language help the data tell its story.
We promise accuracy. We won’t allow error or ambiguity to undermine scientific findings. Consumers are increasingly skeptical of data, thanks to a flood of questionable research. Our reputation for impeccable accuracy promotes confidence in our clients’ work.
Contact Us
NORC VizStudio Experts
-
Leah Christian
Senior Vice PresidentSurvey Design & User Experience -
Ned English
Associate DirectorMapping & Geospatial Oversight -
Peter Herman
Senior Research MethodologistMapping -
Greg Lanier
Senior Vice President & Chief Communications OfficerStrategic Direction & Planning -
Kiegan Rice
Senior StatisticianStatistical Graphics & Programming -
Mark Sheehy
Editorial DirectorNarrative & Messaging -
J. Gordon Wright
Digital DirectorDigital Strategy
Increase the Impact and Reach of Your Data
We translate science you can trust into clear and compelling visuals that invite readers to explore and interpret the data.
