Charts to Explore the Medicare Population


February 2024
The MCBS Chartbook includes charts on the overall Medicare population, beneficiary health and well-being, health care access and satisfaction, and health care use and expenditures.
The Medicare Current Beneficiary Survey (MCBS) is a leading source of information on Medicare and its impact on the health and well-being of beneficiaries.

NORC supported the Centers for Medicare & Medicaid Services (CMS) with the development and release of the MCBS Chartbook, an interactive data visualization tool designed to increase the accessibility and utility of the survey data. The MCBS Chartbook website provided the public with a collection of interactive charts and corresponding tables presenting 2015-2022 estimates from both the MCBS Survey File and Cost Supplement File.
Beginning with the release of 2021 MCBS data, the online MCBS Chartbook replaced the PDF version that had been updated and released annually on the CMS MCBS website. The MCBS Chartbook website was decommissioned in January 2026 as MCBS data tools and systems were migrated to CMS servers.
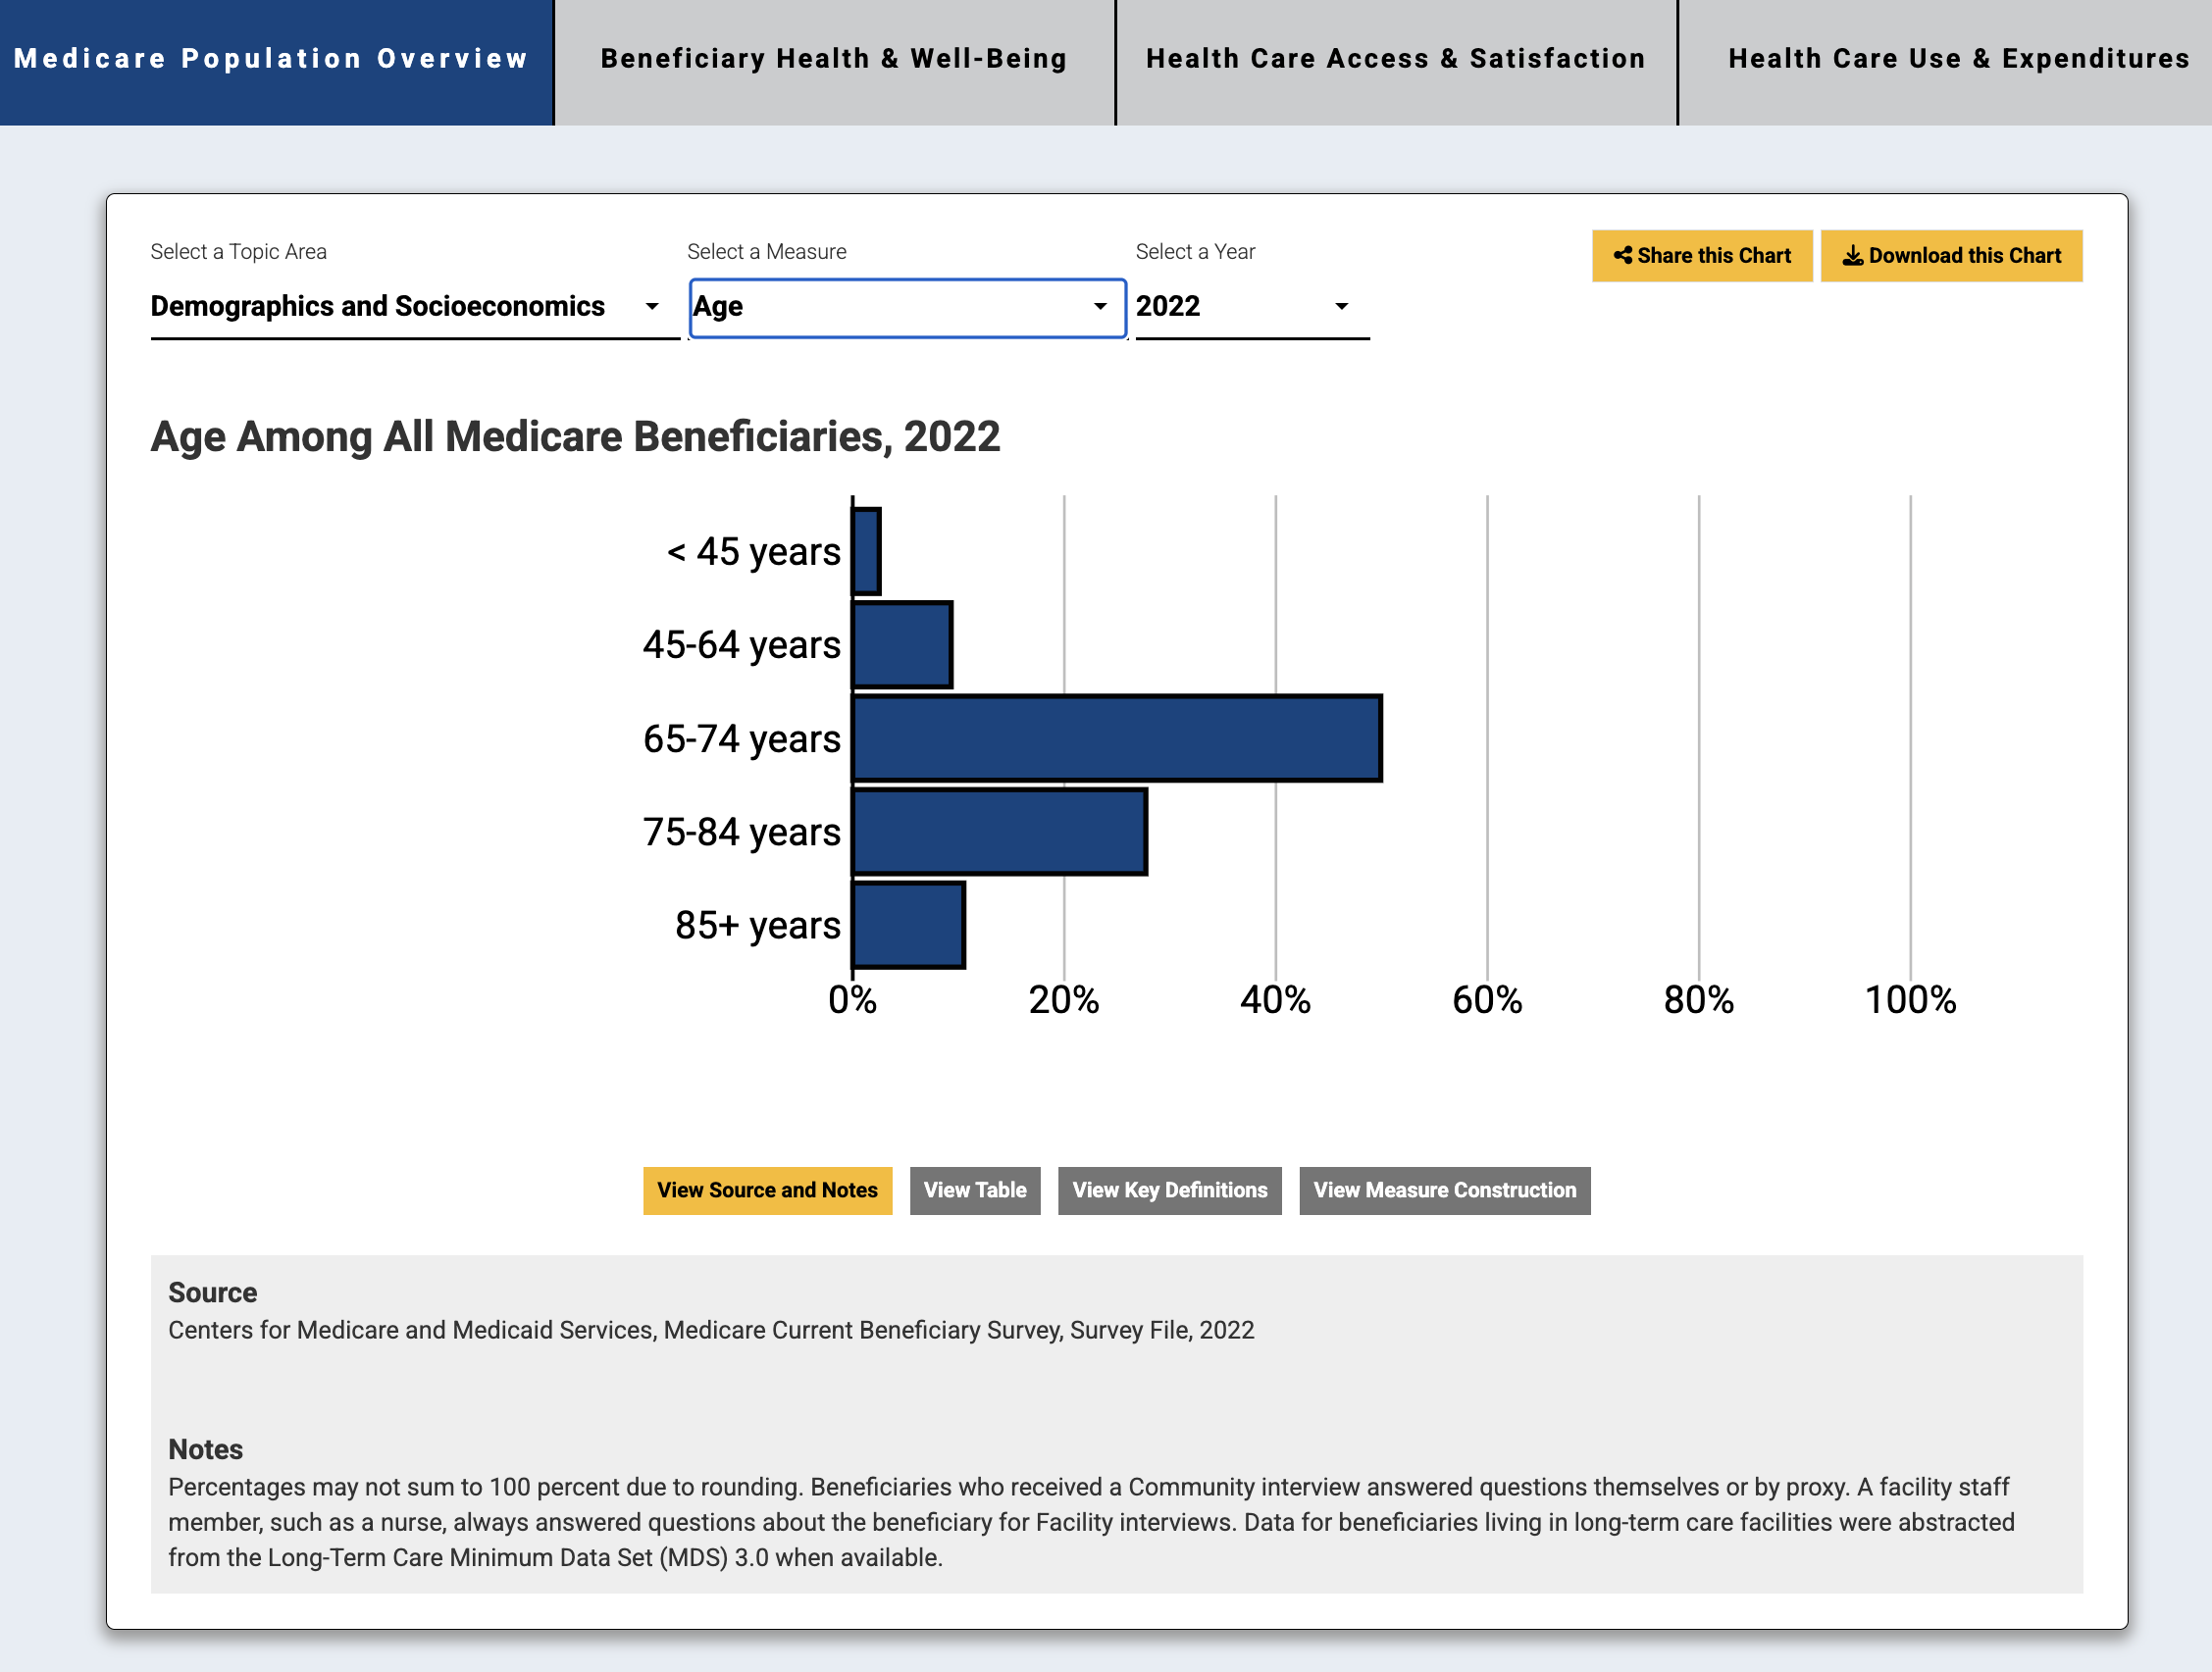
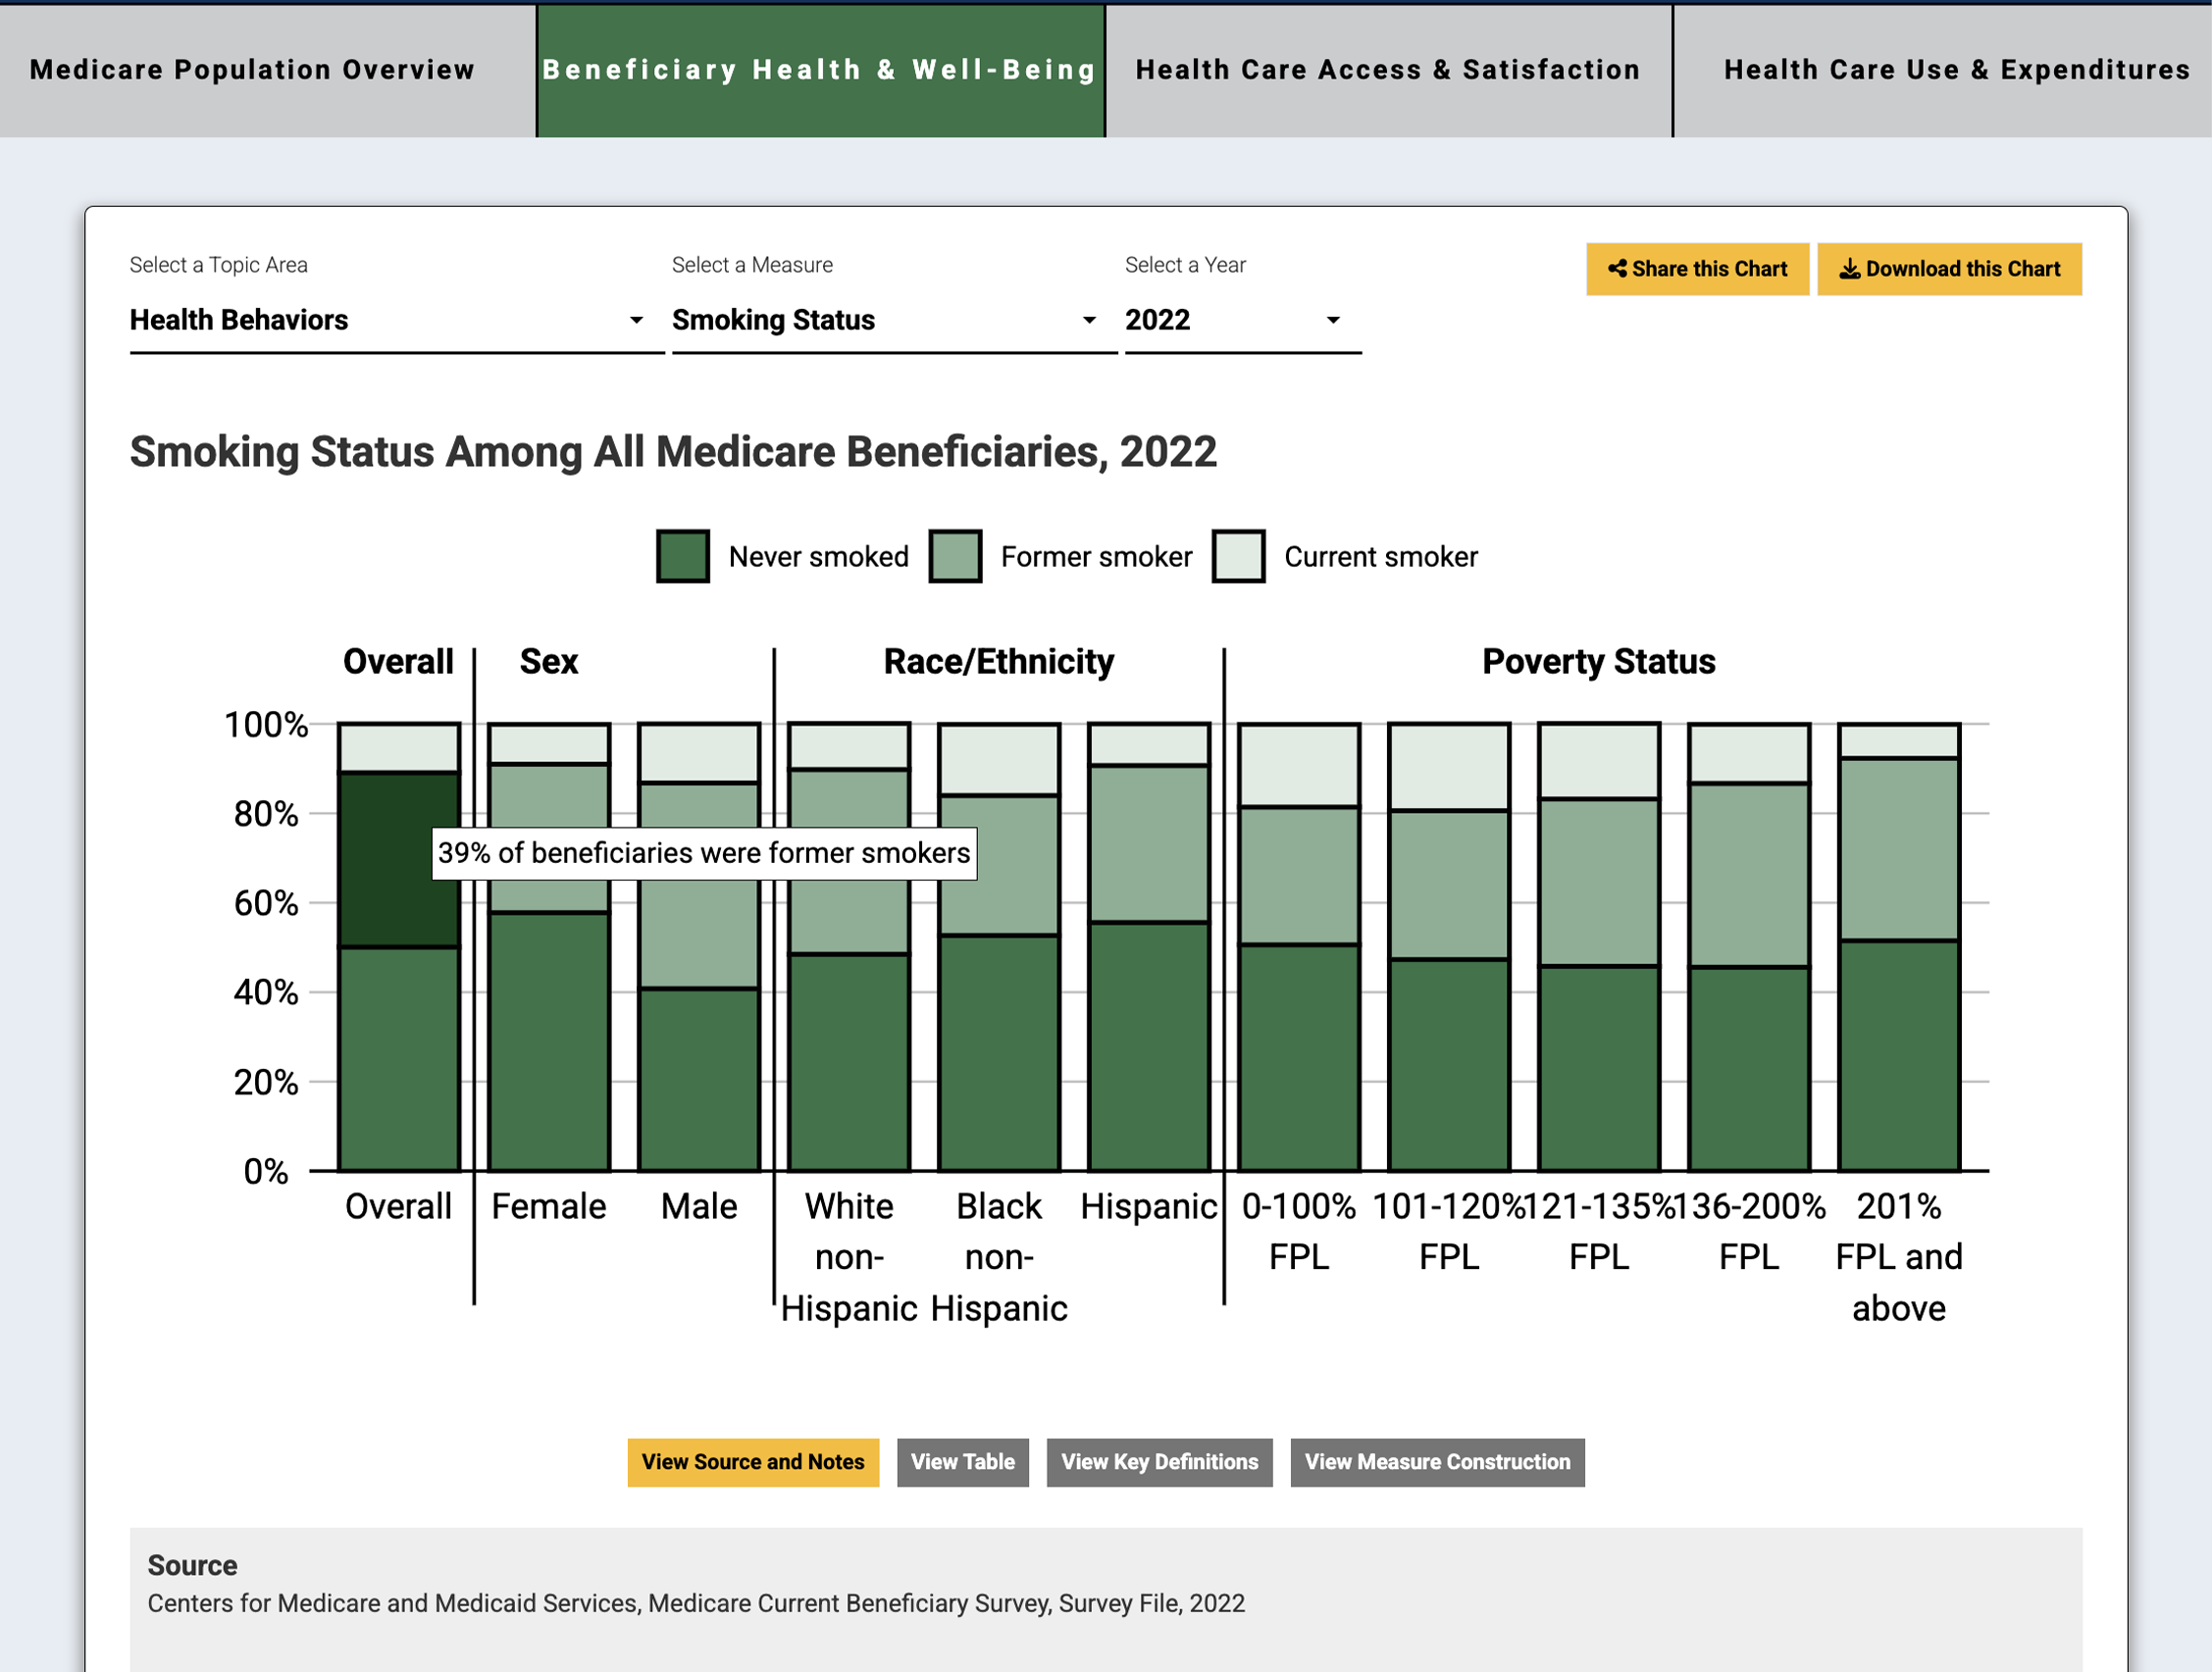
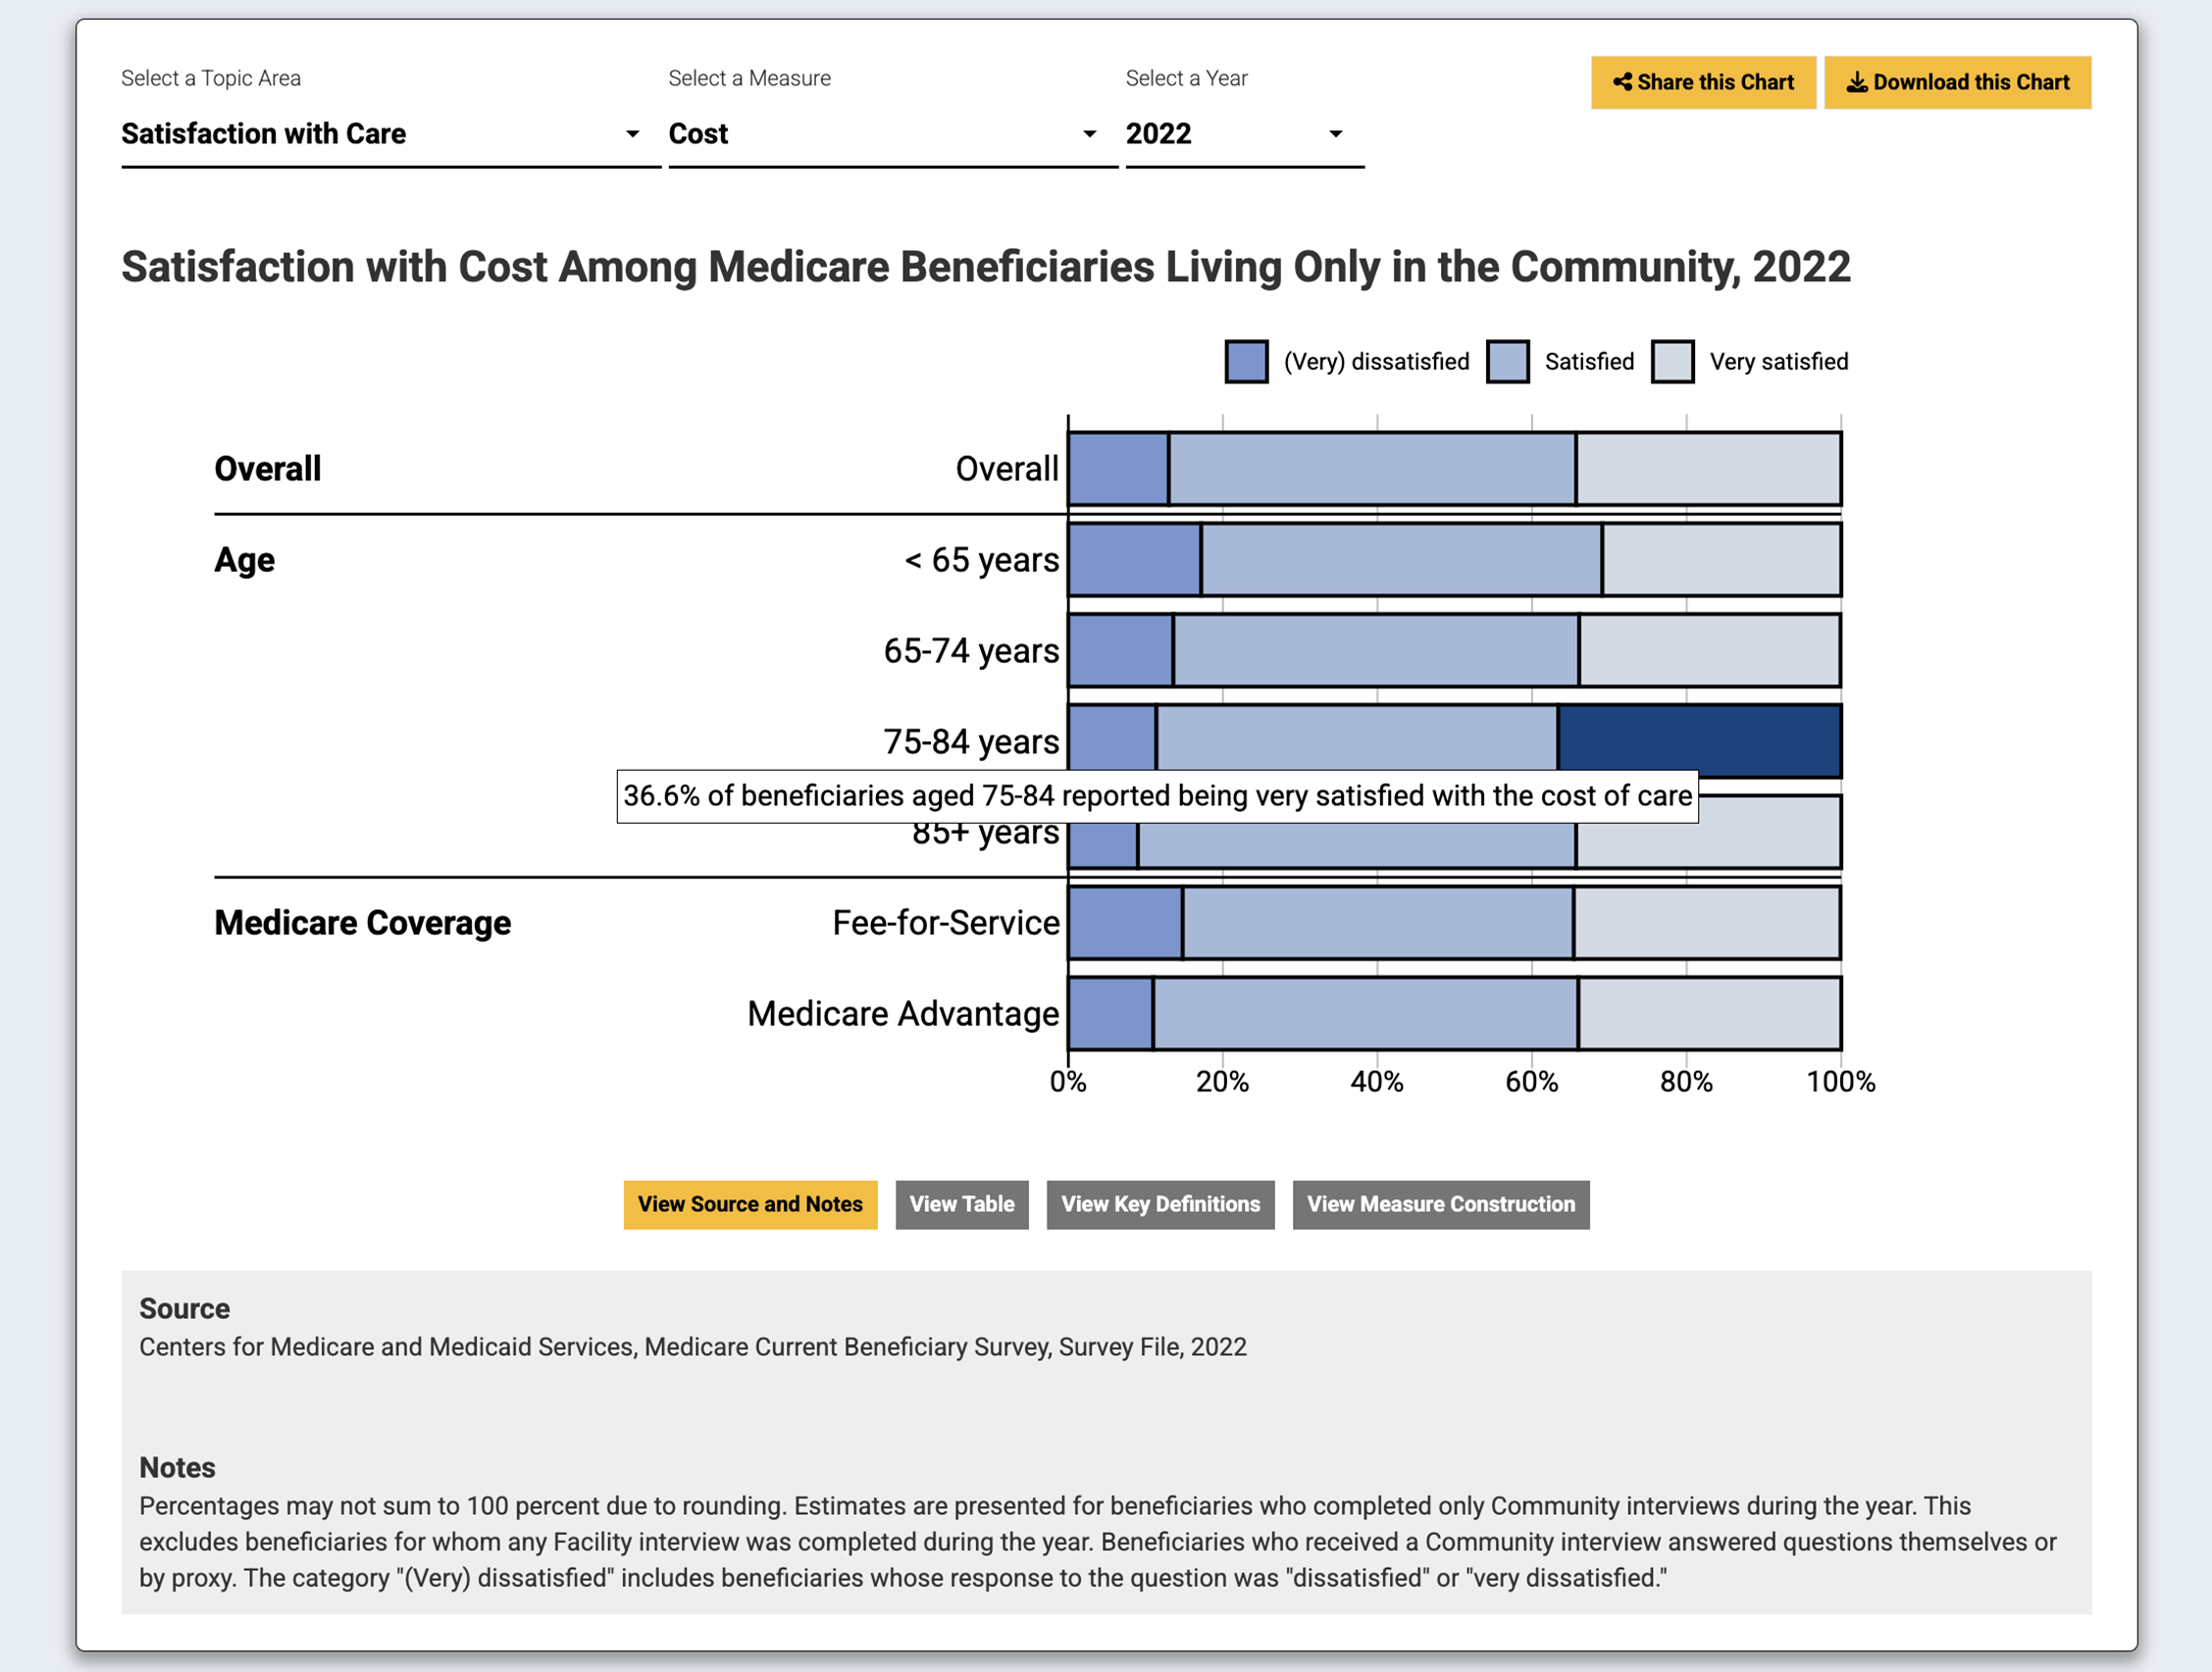
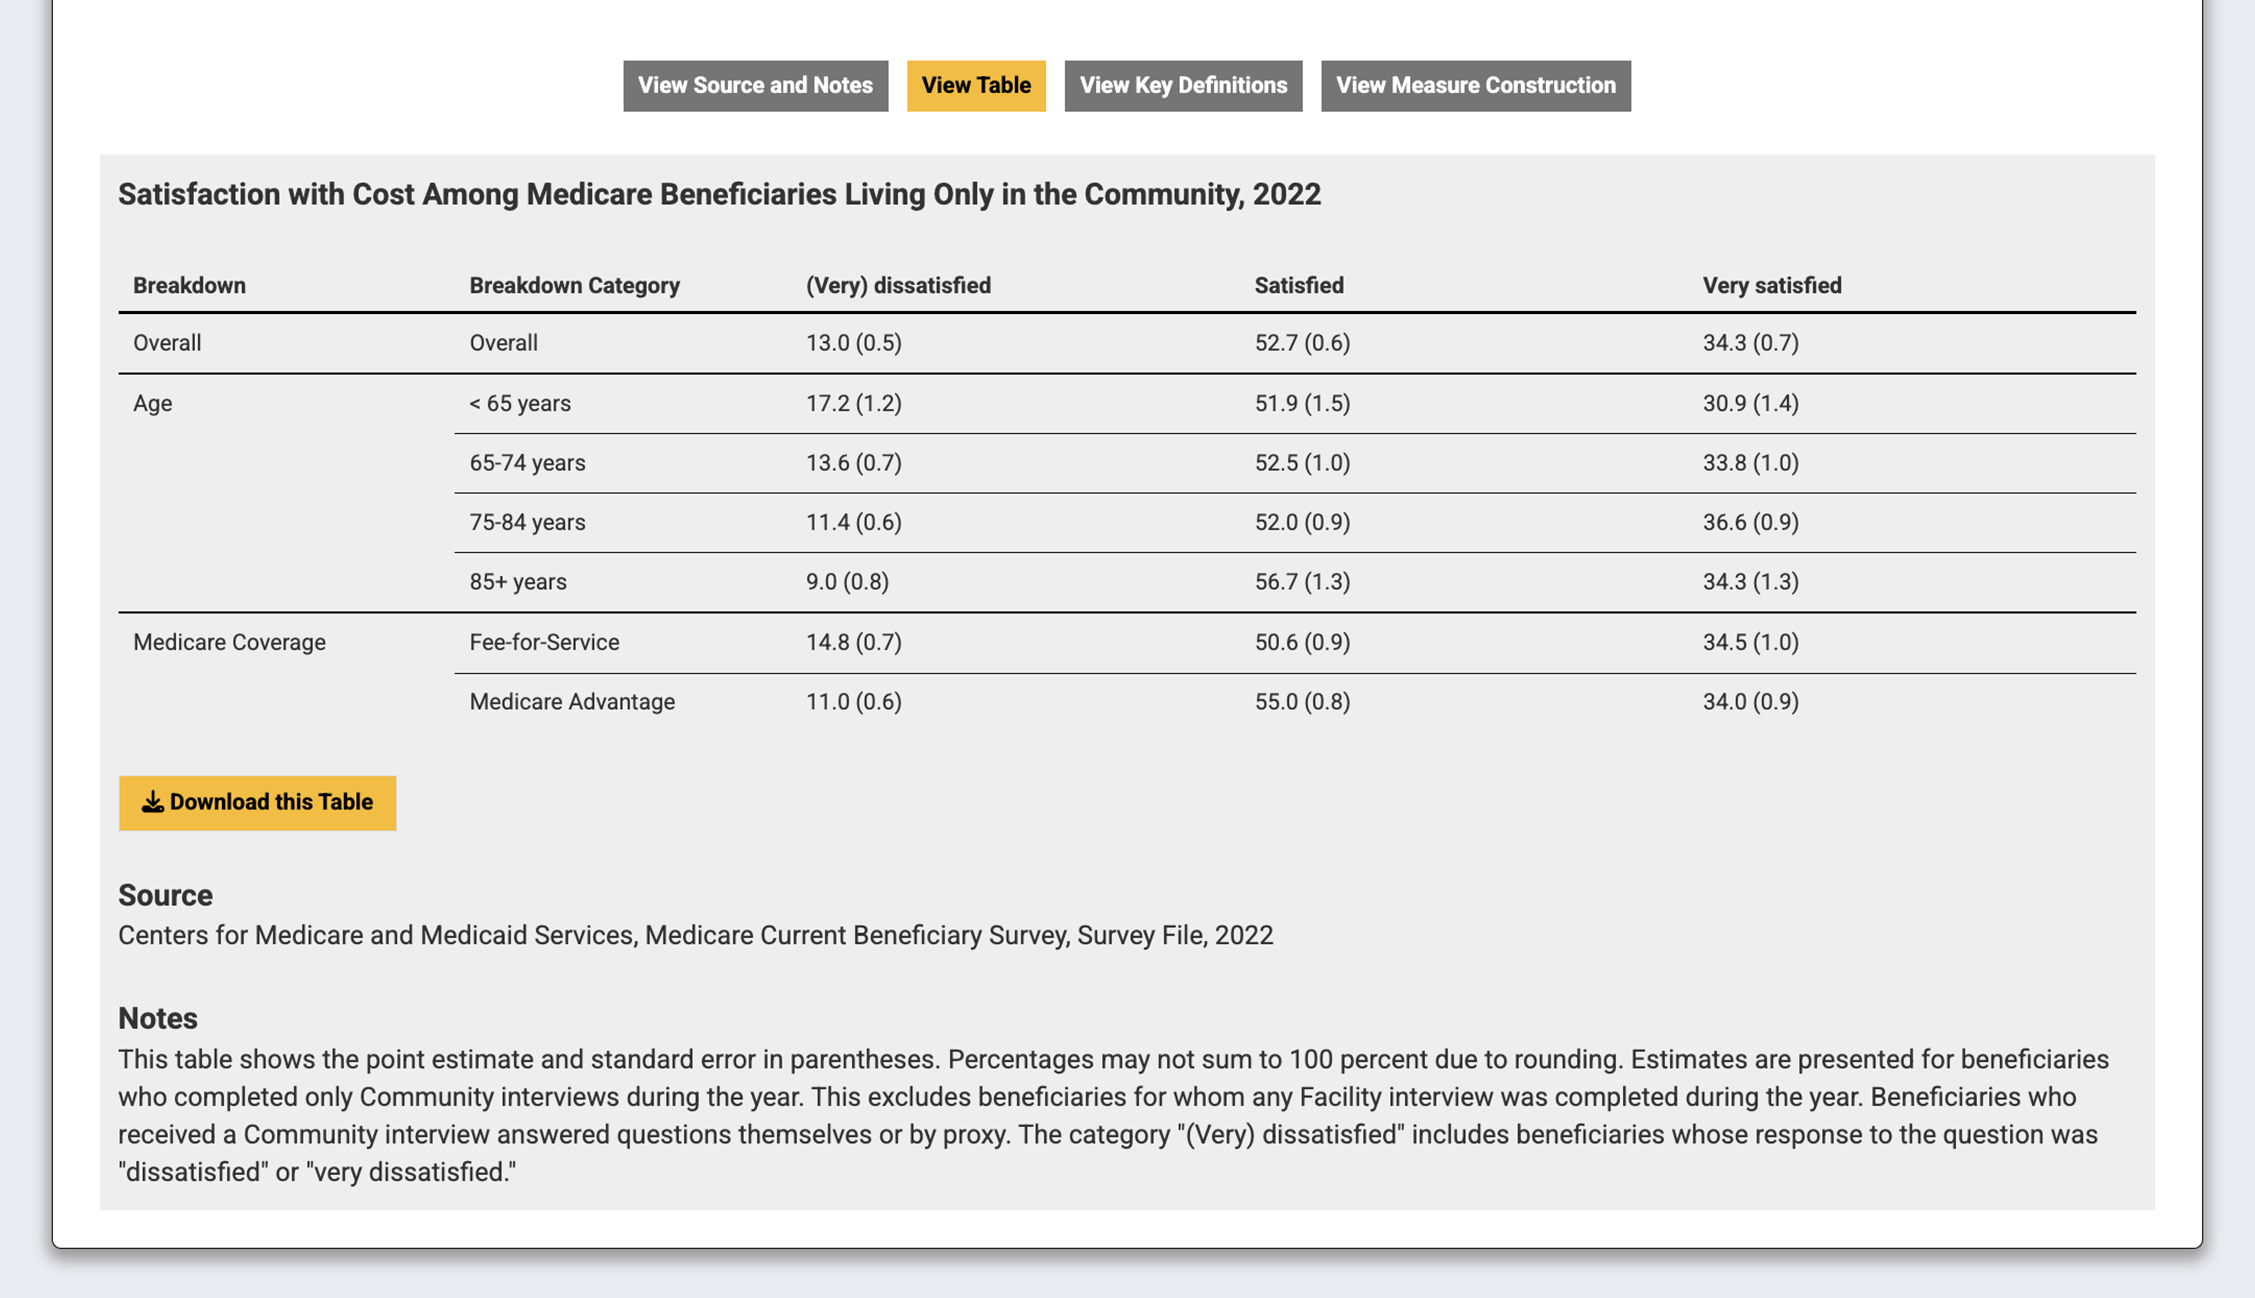
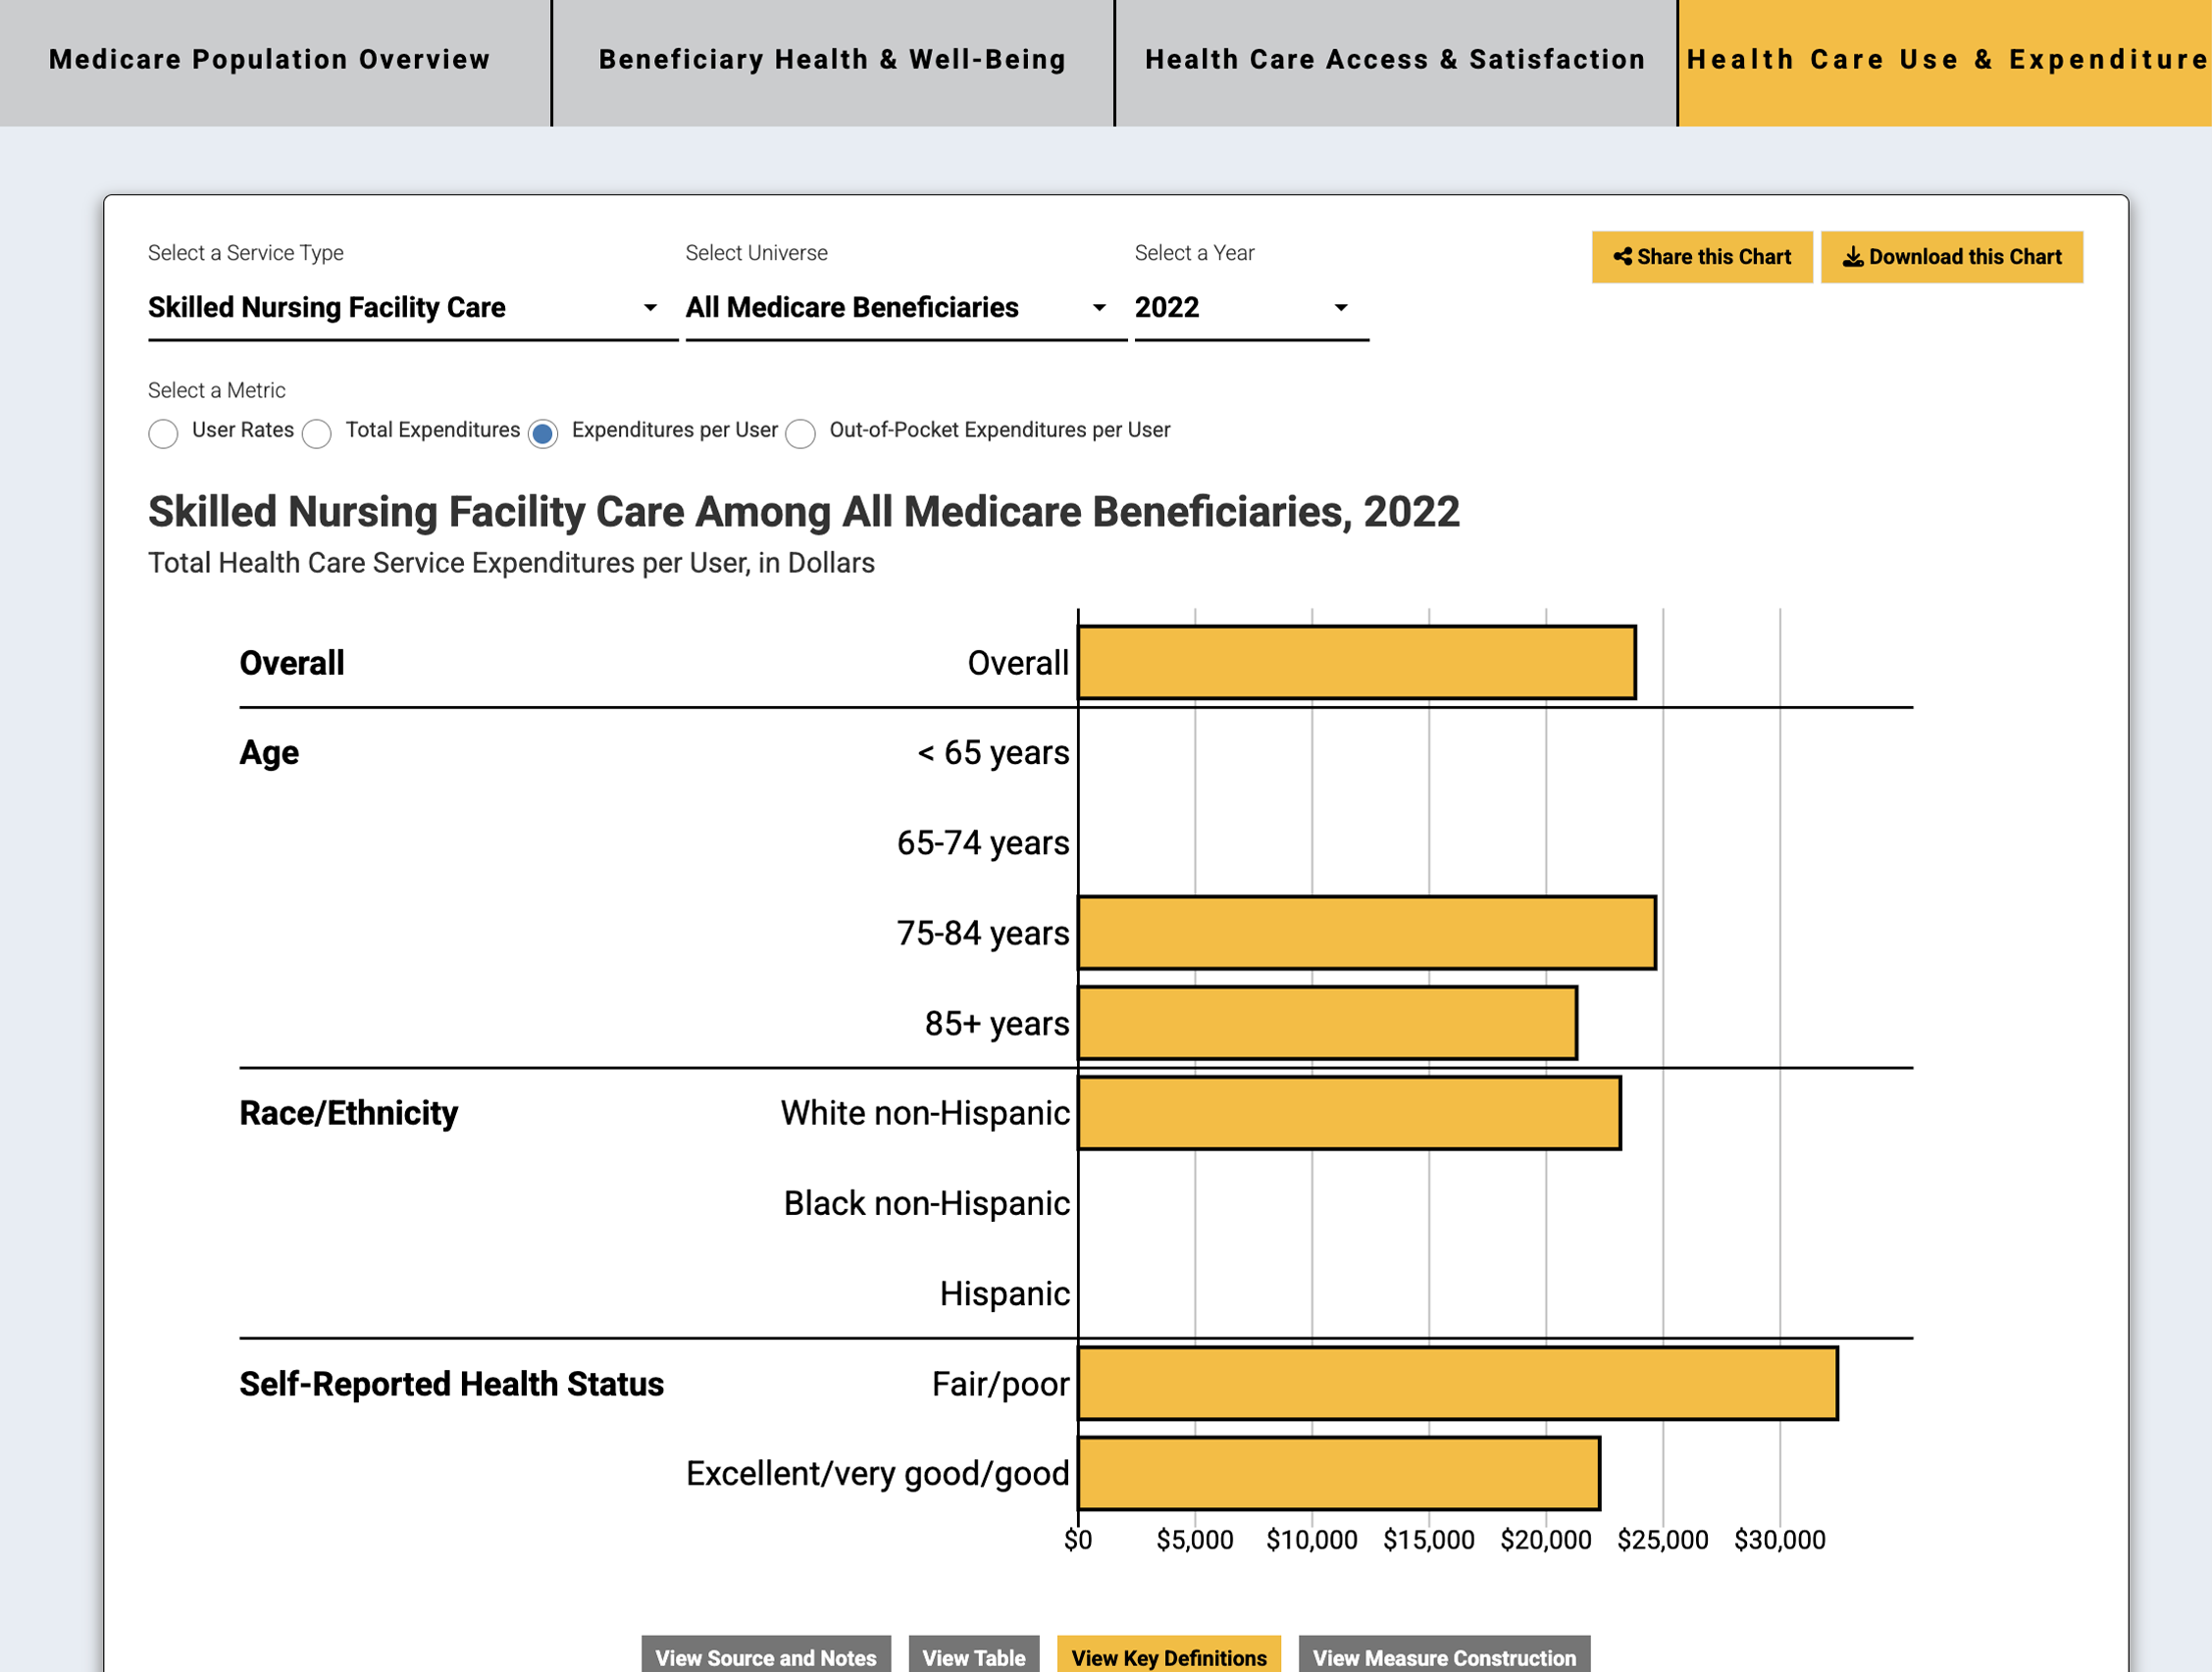
The MCBS Chartbook website allowed users to explore data across four key domains: an overview of the Medicare population, beneficiary health and well-being, health care access and satisfaction, and health care use and expenditures. Users could create customized charts and corresponding tables for a wide variety of measures using drop-down menus and filter lists.
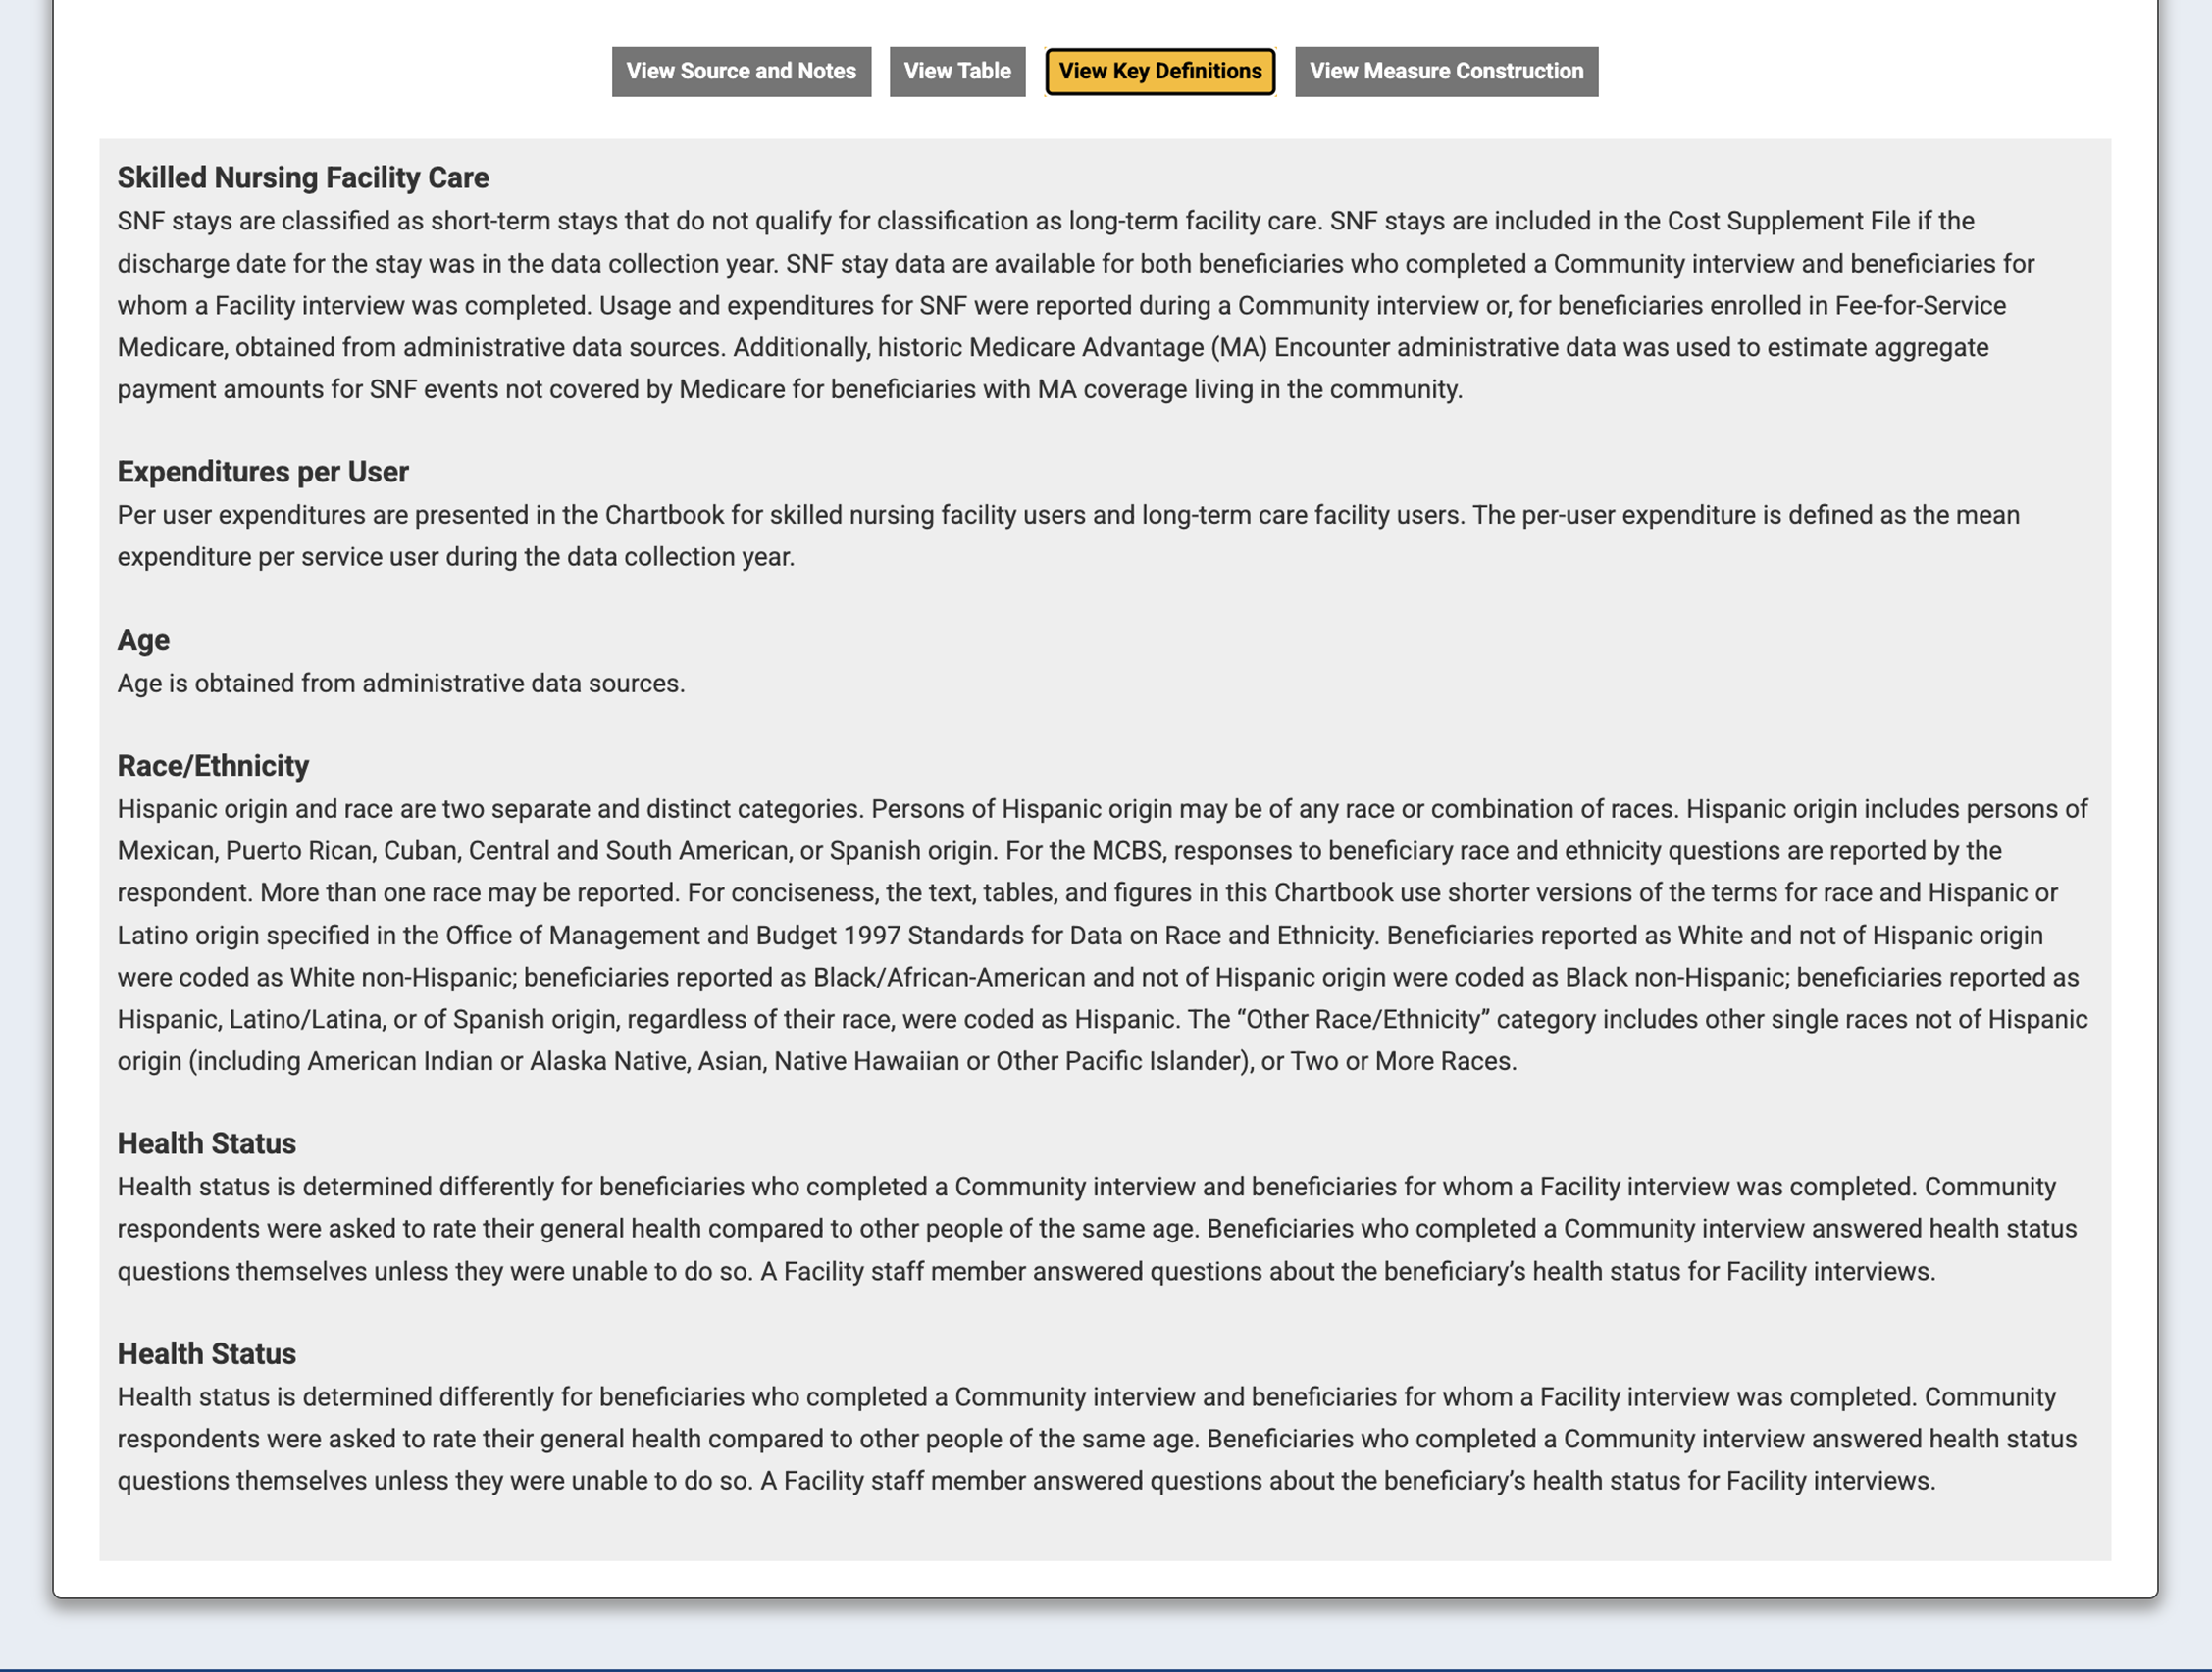
Each interactive chart included information on the source MCBS data file, interpretive notes, and detailed definitions and measure construction details. The site featured rich interactivity, including the ability to share and download individual charts and tables, interactive hover-overs with data point interpretations, and a comprehensive “About” page with methodology, relevant resources, and user guides.
A Look at the MCBS Chartbook
This visualization was created by NORC’s VizStudio, a creative community of experts who turn complex data into compelling visual stories.